Who it is for · ·
Web tables to Markdown: 12 of 15 survive the trip
To bring web tables to Markdown, Clean Web Clipper serialises each table itself, rather than handing it to a generic HTML-to-Markdown converter, so a cell holding a list, a link or a code sample gets flattened instead of breaking the whole row. Generic converters typically drop exactly the tables that carry the numbers worth keeping.
Where these numbers come from: the benchmark, with engine versions and dates
Where do the numbers go missing?
The table is the reason you saved the page: pricing tiers, rate limits, retention periods, a schema. You paste the clip into your notes and find one row spread over a page, pipes in the wrong places, and a column that has silently merged with its neighbour. The numbers are still on screen behind you in the browser, so the failure is easy to miss, until the tab is gone.
The opposite failure costs the same afternoon. Plenty of sites still use a table purely for positioning, and a converter that treats every one of them as data hands you twenty rows of navigation dressed up as a dataset. One outcome is spent retyping numbers, the other deleting a grid, and neither is the analysis you sat down to do.
Retyping has a third cost that shows up much later. A number typed into a sheet by hand carries no source, no date and no way to check it – six weeks on, nobody can say whether the retention period in cell D14 was read off the page in January or in March, and the page has been edited twice since. Pricing, rate limits and quotas change without an announcement. A captured table with the source URL and the page’s declared date above it answers that question, and answers it again next quarter when you capture the same page and diff the two.
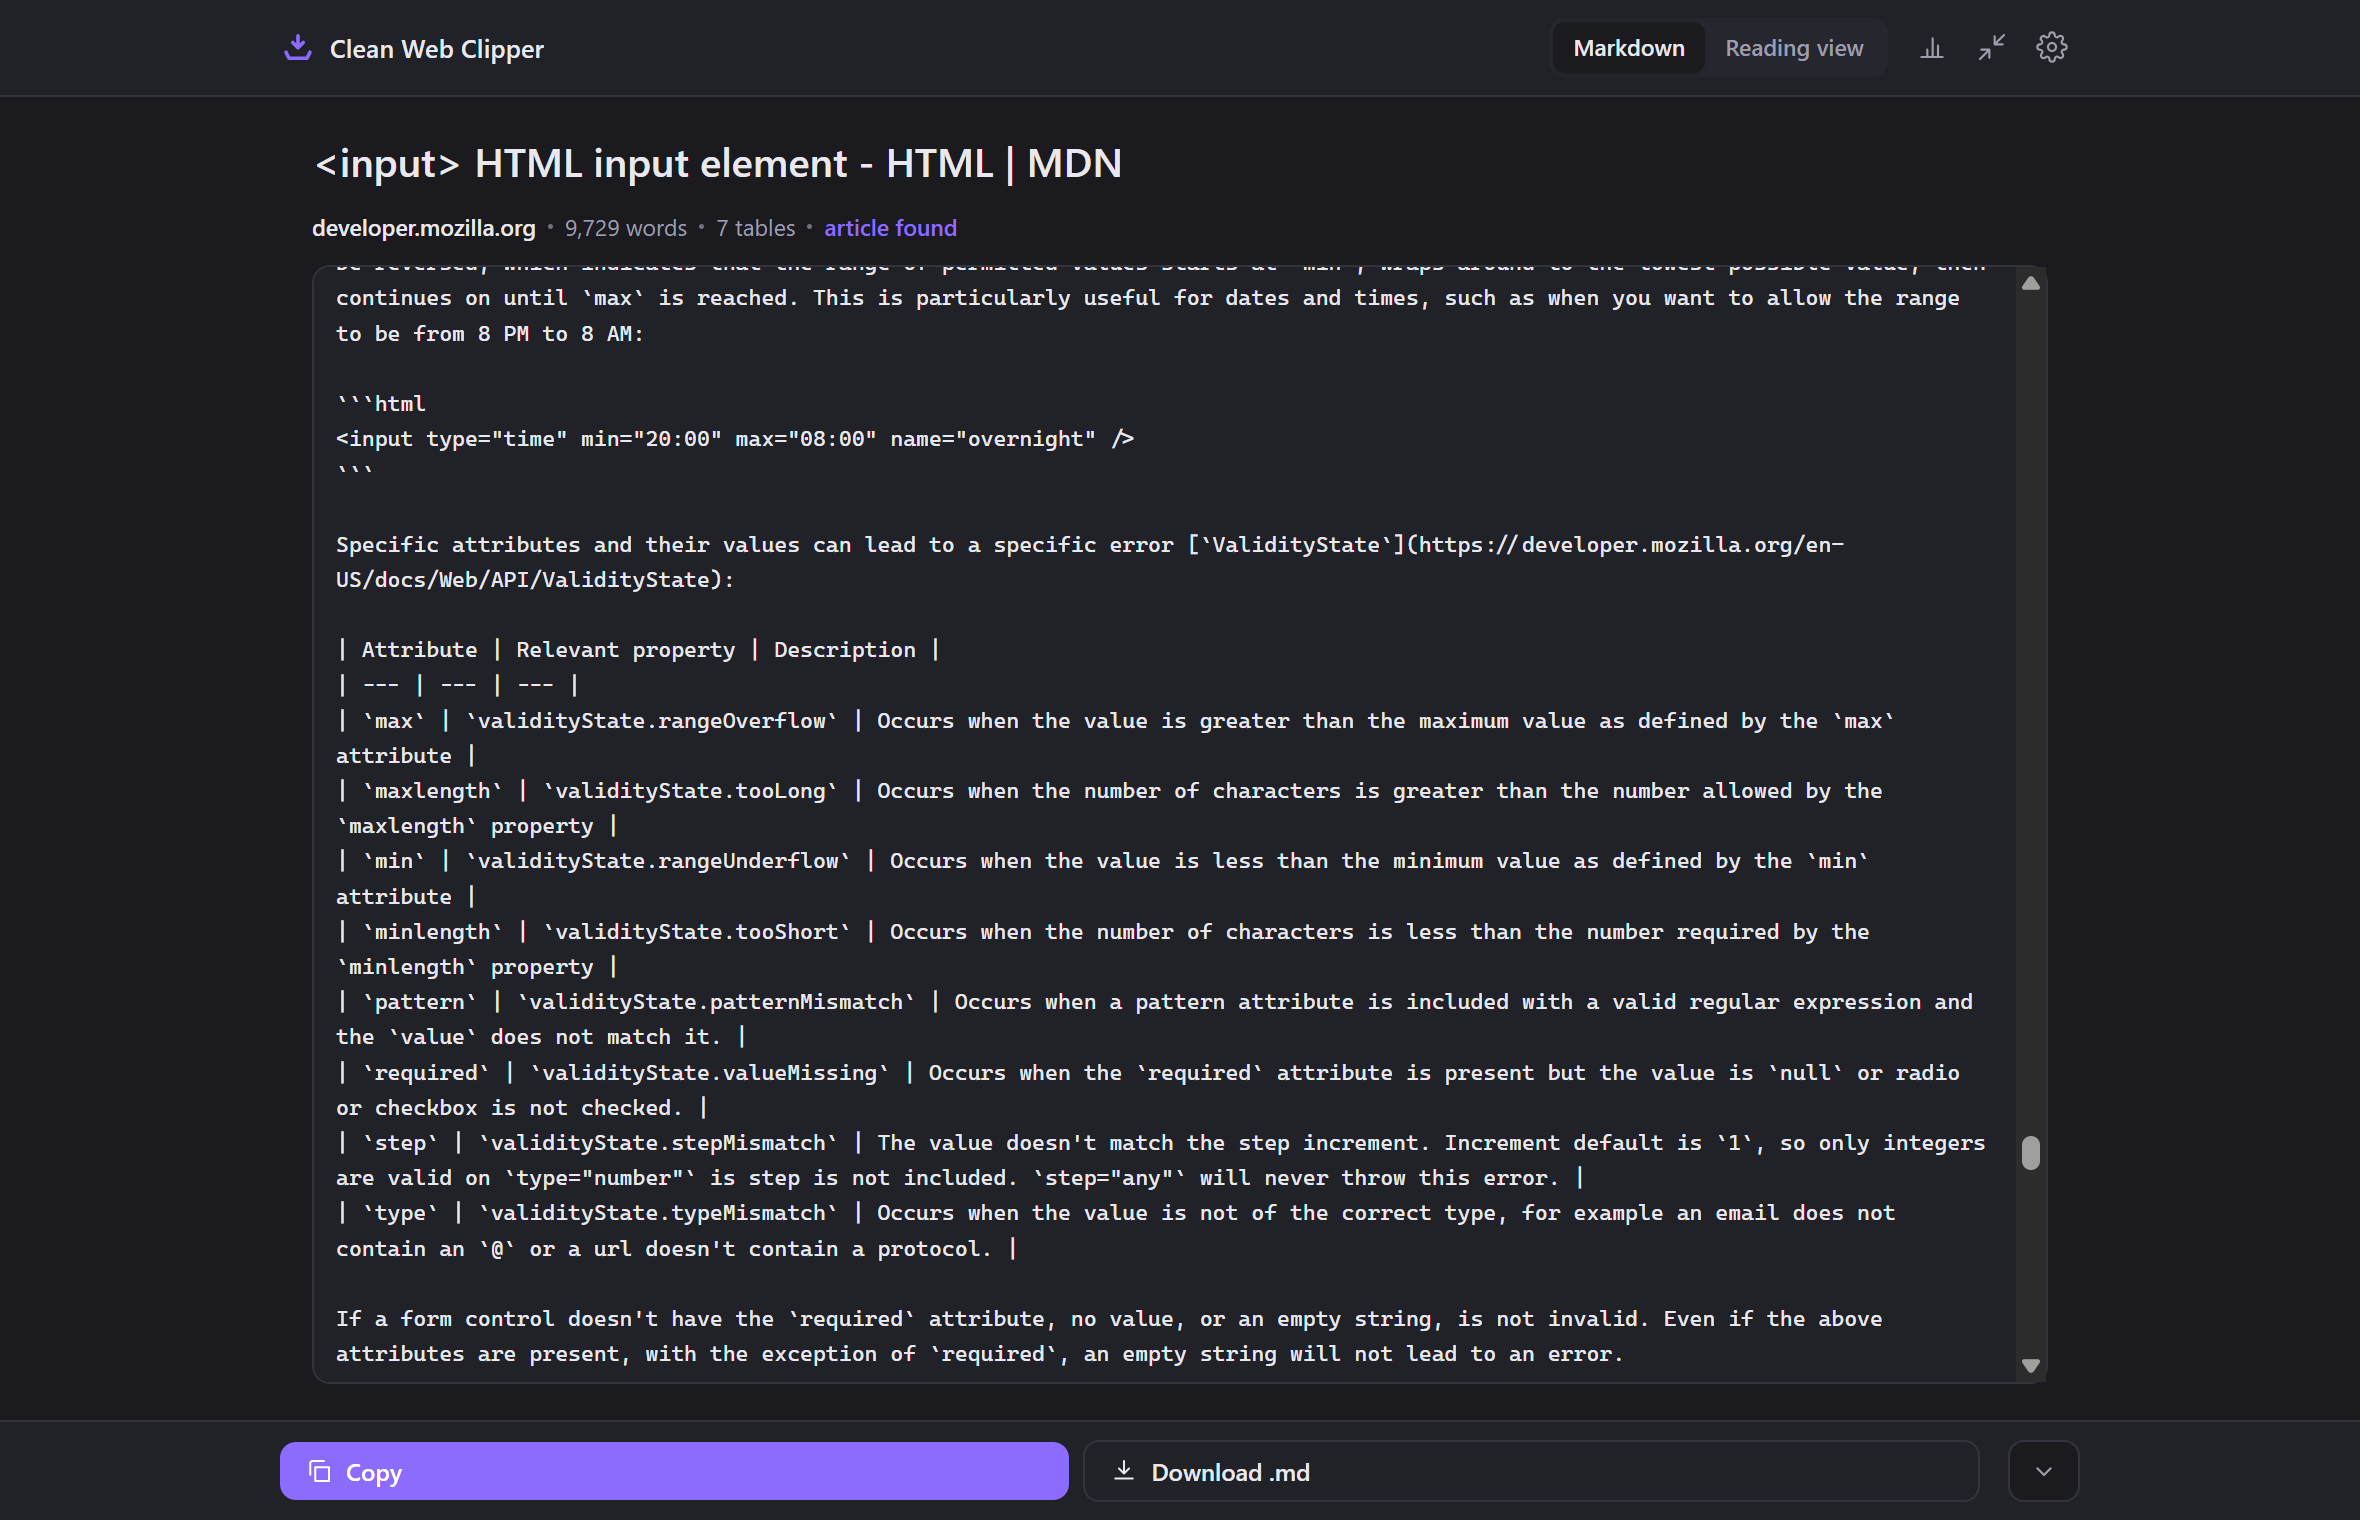
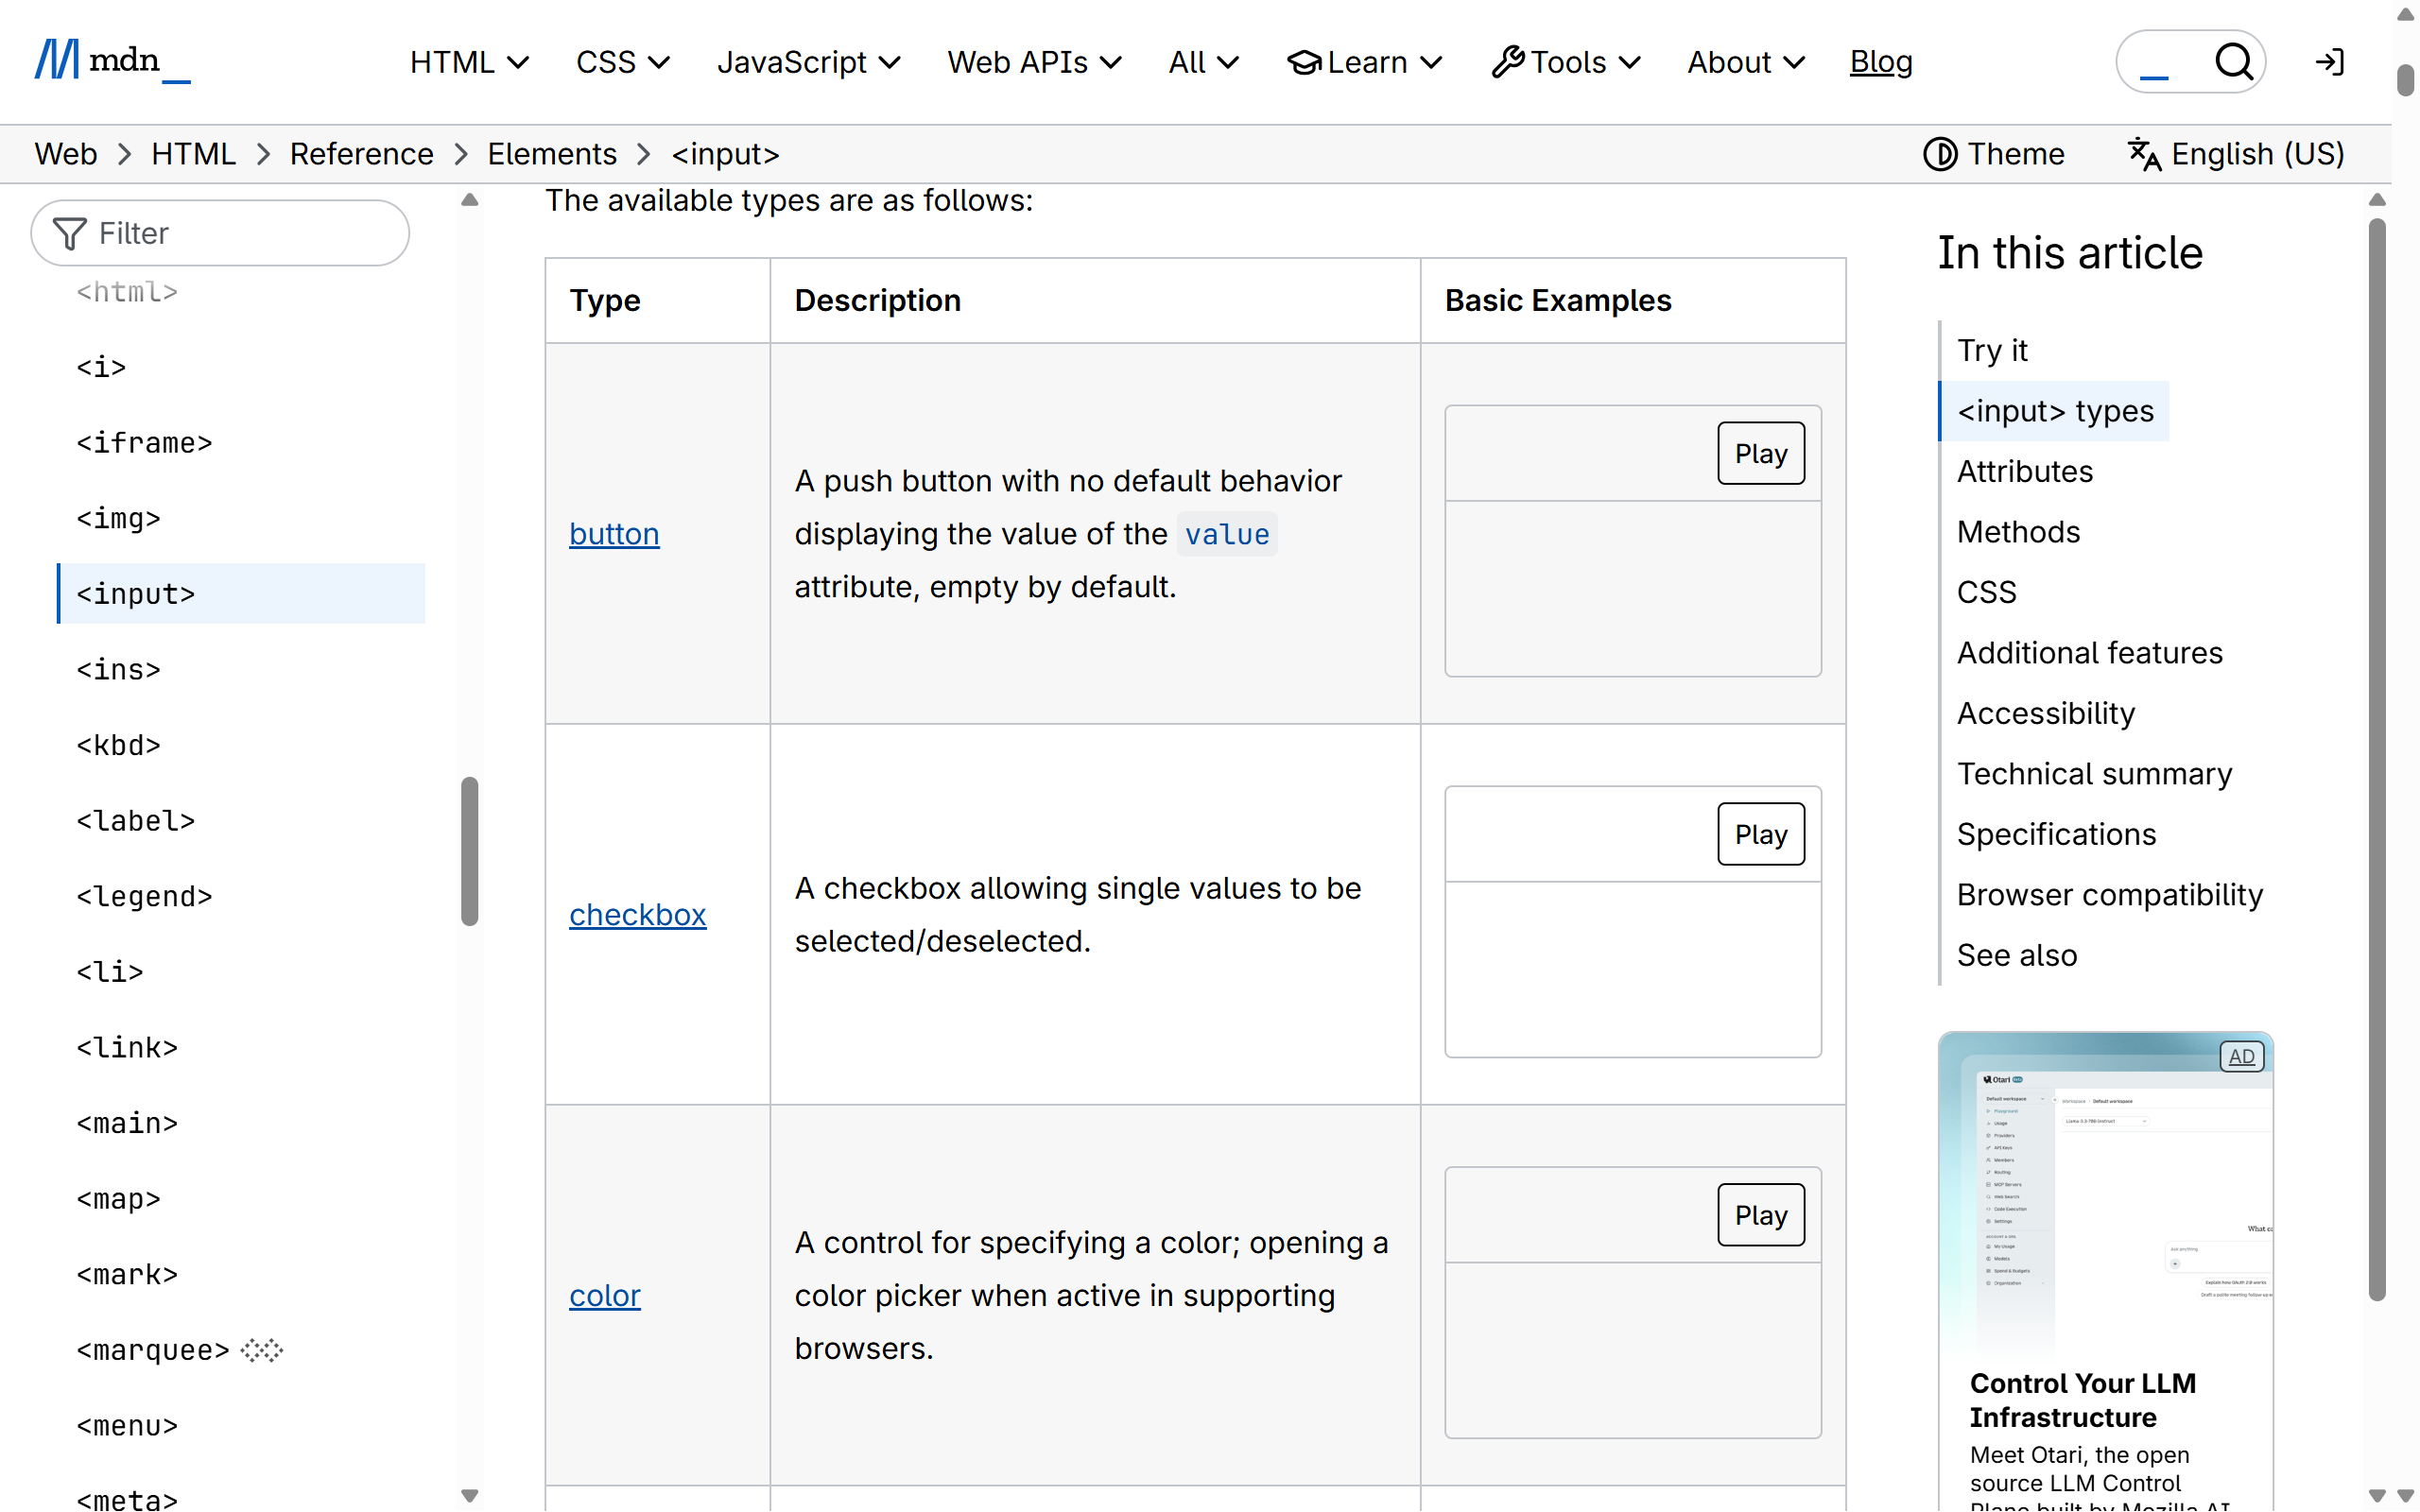

What comes across, and how often?
- A GFM table serialiser written for this, not a generic converter plugin bolted on.
- 12 tables of 15 kept on the technical corpus, against 7 for each engine compared.
- Ragged two-column tables become bold key and value lines instead of a broken grid.
- Layout tables are unwrapped – grids used only for positioning give up their content without the grid.
- Code inside a cell stays code, with a language tag on the fence where the site declared one.
- Select a table on the page and clip the selection, when the surrounding article is not needed.
- The source URL and the page’s declared date sit above the table, so a set of numbers carries the date it was valid on rather than the date you happened to file it.
- A second capture of the same page takes a numeric suffix instead of overwriting the existing file – which is what makes a quarterly diff possible at all.
| Storage class | Meaning                                                |
| ------------- | ------------------------------------------------------ |
| `NULL`        | The value is a NULL value.                              |
| `INTEGER`     | A signed integer, stored in 1, 2, 3, 4, 6 or 8 bytes.   |
| `REAL`        | A floating point value, stored as an 8-byte IEEE number.|
| `TEXT`        | A text string, stored using UTF-8, UTF-16BE or UTF-16LE.|
| `BLOB`        | A blob of data, stored exactly as it was input.         |
Set it up for tables
Two settings and one habit. The habit, scrolling before you clip, recovers more rows than any setting can.
- Open Options from the extension icon and point the destination at the folder where the working data lives –
data/sourcesbeside the notebook or the sheet that consumes it. - Leave the icon click as the preview window. A table is the one thing worth looking at before it is filed – whether the columns line up is visible in one glance and invisible in a folder listing.
- Set the filename template to
{date}-{domain}-{title}, and save each quarter’s round into its own subfolder, named for the quarter. There is no separate variable for the clip day:{date}is the publication date whenever the page declares one, so every capture of a dated page gets the same date, and only the folder keeps them in capture order. A repeated name in the same folder gets a number added instead of replacing the existing file. - Turn on
sourceanddatein the frontmatter. A table without the address it came from is a set of numbers somebody will eventually have to re-derive. - Before clipping, scroll to the bottom of the table. Rows that load as you scroll do not exist in the DOM until they have loaded, and the extension reads the DOM at the moment you clip.
- When the surrounding article is irrelevant, select the table on the page and clip the selection. The switch at the top of the window confirms you are looking at the selection rather than the whole page.
- Put a recurring capture in the calendar for the pages whose numbers move: quotas, prices, retention periods. The value of the corpus is in the second capture, not the first.
Which settings suit numbers you will reuse?
The point of every value below is that a table read six months from now should still say where it came from and when.
| Setting | Value | Why this value here |
|---|---|---|
| Icon click | Preview window | A misaligned column is obvious on sight and invisible in a file listing |
| Destination | Folder data/sources | Keeps the captures next to the notebook or sheet that consumes them |
| Filename template | {date}-{domain}-{title} | Date and site in the name; capture order comes from a subfolder per quarter, since {date} is not the clip day on dated pages |
| Frontmatter | source and date on | The two lines that turn a set of numbers back into a citable fact |
| Images | Skip | Charts arrive as image links either way; the extension does not read numbers out of a picture |
| Selection | Select the table, clip the selection | A twelve-screen article around a four-row table is noise in a data folder |
| Repeat capture | Clip the same page each quarter | The numeric suffix keeps both, and the diff is the analysis |
**Content-Type**
: The media type of the resource. Required on every request with a body.

**Cache-Control**
: Directives for caching mechanisms in both requests and responses.

**Retry-After**
: Either a delay in seconds or an HTTP-date after which to retry.

The source grid had merged header cells and a nested list in the last row.
Reproduced as a Markdown table it would have broken; as pairs it does not.
See three tables, three outcomes
Three tables below show three different outcomes: four pricing pages assembled into a comparison sheet without retyping a number, one provider’s limits compared a quarter apart to catch an unannounced change, and a ragged two-column grid that comes across as key-value lines instead of a broken table. Each depends on the serialiser reading the table itself, not a generic converter.
A pricing table into a comparison sheet
Four vendors, four pricing pages, four captures. Each table comes across as a GFM table with the plan names, the amounts and the limits in the cells they were in, and the source URL above it, so the comparison sheet is assembled without a single number being retyped.
This is where the serialiser earns its place – the cells that break generic converters are the ones with a footnote marker, a list of included features or a code sample inside. On the fifteen-table technical corpus twelve tables survived here against seven for each engine compared.
The same page, a quarter apart
You captured a provider’s rate limits in February and again in May. The second file took a numeric suffix. A diff shows the burst allowance halved on the starter plan and the retention window on the top plan extended – neither of which was announced anywhere.
Without the February file the change is unprovable, because the page shows only its current state and the previous numbers exist nowhere the vendor publishes. The whole method depends on the first capture having been cheap enough to take before you knew it mattered.
A grid that could not be a table
A specification page defines twenty headers in a two-column grid with merged header cells and a nested list in one row. Reproduced as a Markdown table it would have collapsed; instead it comes across as bold key lines with their values underneath, which is lossless for reading and for searching.
That behaviour is deliberate rather than a fallback failure. Ragged two-column tables are far more often definition lists wearing a grid than they are data, and a broken pipe table is harder to repair than a list is to read.
How does it compare to the usual ways to move a table?
Every one of these gets numbers off a page. They differ in what arrives with the numbers and in what you have to do afterwards.
| How it is done now | What you get | What it costs |
|---|---|---|
| Retype into a sheet | Exactly the cells you need | Transcription errors, and no record of the source or the date |
| Copy and paste into a spreadsheet | Often the grid, sometimes | Fails on cells with lists or code; layout grids come across as data |
| Screenshot the table | The table as displayed | Nothing computable, nothing searchable, no source line |
| The site’s own CSV export | Clean data, when it exists | Most pages offer none, and the export sometimes differs from what is displayed |
| A generic HTML-to-Markdown converter | Markdown, quickly | A cell with a list or a code block is where generic converters break |
| Clean Web Clipper | A GFM table with the source and date above it | No merged cells, no CSV export, and no numbers read out of a chart image |
What happens when a table does not come out right?
Four outcomes cover almost every case: merged cells flattened because Markdown cannot express them, rows missing because the page had not finished loading them, a navigation grid mistakenly marked up as data, or a ragged table turned into key-value lines on purpose. Each is explained below, with the reason it happens rather than just the symptom.
The merged cells are gone
Markdown has no merged cells, so colspan and rowspan are flattened – the content is preserved and the visual merge is not, because the format cannot express it. Where a merged header spanned three columns, the text lands in the first of them. This is a property of the target format rather than of the conversion, and no Markdown table anywhere expresses it.
Half the rows are missing
The extension reads the DOM at the instant you clip, so rows that a page loads as you scroll (or serves through a “show more” button, or paginates) do not exist yet unless you have caused them to. Scroll to the bottom, expand what expands, then clip. For a paginated table, clip each page – the parts can be joined afterwards, and nothing else can recover rows the browser never received.
I got a grid of navigation instead of data
A grid of navigation is a layout table: a grid used purely for positioning, which many older sites still use for menus and headers. Those are unwrapped rather than converted, so the content comes through without the grid. If a navigation grid did reach the note as a table, it is because the page marked it up as a data table – the markup said “data” and the extension believed it.
The table came out as key and value lines
Key and value lines come from the ragged two-column path. A two-column table with uneven rows is usually a definition list drawn as a grid, and reproducing it as a pipe table produces a broken grid rather than a readable one. The content is complete: bold key, value beneath it, in the original order. If you need it as a real table, the pairs convert back mechanically.
Where does the format give out?
Markdown has no merged cells, so colspan and rowspan are flattened – the content is preserved, the visual merge is not, because the format cannot express it. A table nested inside a cell is hard for every tool and this one is no exception. Clean Web Clipper does not read numbers out of a chart image, and it exports no CSV or XLSX. And it converts one page at a time – the page you are on.
The output is Markdown, and only Markdown.
What does a table keep, and what does it lose?
What happens to a table used purely for layout? A layout table is unwrapped. Reproducing a positioning grid as a Markdown table produces noise, so the content is kept and the grid is not.
Are merged cells supported?
Can I clip only the table?
Can I get CSV out of it?
What about tables that load more rows as you scroll?
Is the column formatting preserved?
Where does table extraction stop?
Does it read numbers out of a chart? No. A chart is an image or a canvas, and the extension does no image processing of any kind. Where a page publishes the underlying figures as a table below the chart – many statistical agencies do – that table clips normally.
Does the file record when the numbers were valid?
{date} puts the same date into the filename. Where a page declares no date, the field is left empty rather than filled in, which is at least an honest gap rather than a wrong number; only then does {date} fall back to the day you clipped.